
Why this blog?
Most organizations have invested heavily in predictive analytics, yet many still struggle to convert accurate forecasts into effective operational decisions. This blog explores why prediction alone is no longer enough and how mathematical optimization bridges the gap between insight and execution. Using a real-world warehouse optimization scenario, it introduces readers to optimization modeling, constraint-based decision making, and Python-based operations research techniques. The article serves as the first step in understanding how optimization can complement machine learning to solve complex enterprise decision problems across supply chain, logistics, retail, manufacturing, and beyond.
For the past decade, the business world has been utterly captivated by the power of prediction. We have poured millions into building sophisticated machine learning models that can anticipate consumer demand, forecast market volatility, and flag supply chain disruptions before they happen. Yet, as predictive analytics reaches its peak dominance, a quiet realization is sweeping through the enterprise: foresight alone does not guarantee efficiency.
A flawless forecast can tell you precisely when a storm is coming, but it cannot automatically choreograph the optimal movement of your ships to safety.
As organizations face hyper-complex operational landscapes, the spotlight is shifting. Prediction is no longer the final destination; instead, it is becoming the vital fuel for a fast-emerging dominant force in decision science, Mathematical Optimization. By transforming raw predictions into optimal, constraint-aware action plans, optimization is stepping in to complete the analytical puzzle, shifting businesses from a state of passive awareness to mathematically guaranteed execution. Through this upcoming series of blogs, we will demystify the art and science of mathematical optimization.
Our goal isn’t to replace the predictive tools you use every day, but to supercharge them. We want to equip you with the frameworks needed to seamlessly bridge the gap between what will happen and what we should do. Whether you want to leverage prescriptive modeling to complement your existing machine learning outputs or build parallel, constraint-aware decision architectures from scratch, this series will give you the practical toolkit to drive mathematically guaranteed impact in any business environment.
To understand how optimization supplements prediction, let’s step out of the abstract and onto the physical floor of a massive fulfillment warehouse. Imagine you are a data scientist at a major e-commerce firm, and leadership hands you a classic operational challenge: Maximize order picking efficiency while minimizing total travel distance.
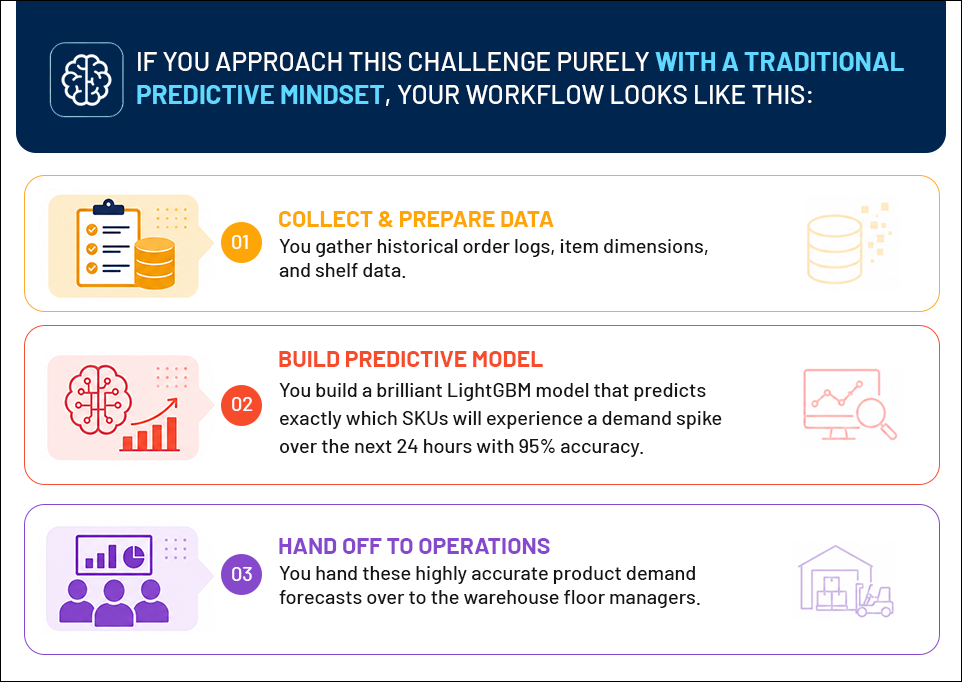
The predictive task is a triumph. But now, the floor manager looks at your demand forecasts and faces a physical reality constrained by spatial geometry and human limits: “Great, we know exactly what products are going to fly off the shelves today. But I have 10,000 incoming orders, a fleet of pickers pushing carts with strict 10kg weight limits, and a warehouse layout mapped to a standard S-Shape routing policy. How do I group these specific orders into batches and assign them to pickers so they aren’t walking miles of redundant aisles?”
This is the exact moment where prediction hands over the baton, and the Optimization Mindset takes over. Instead of asking “What will the order volume be?”, optimization asks: “Given these incoming predicted orders, how do we mathematically bundle them and construct the absolute shortest picking path through the aisles?”
To visualize this shift, look at how this problem plays out in real-time on the warehouse floor:
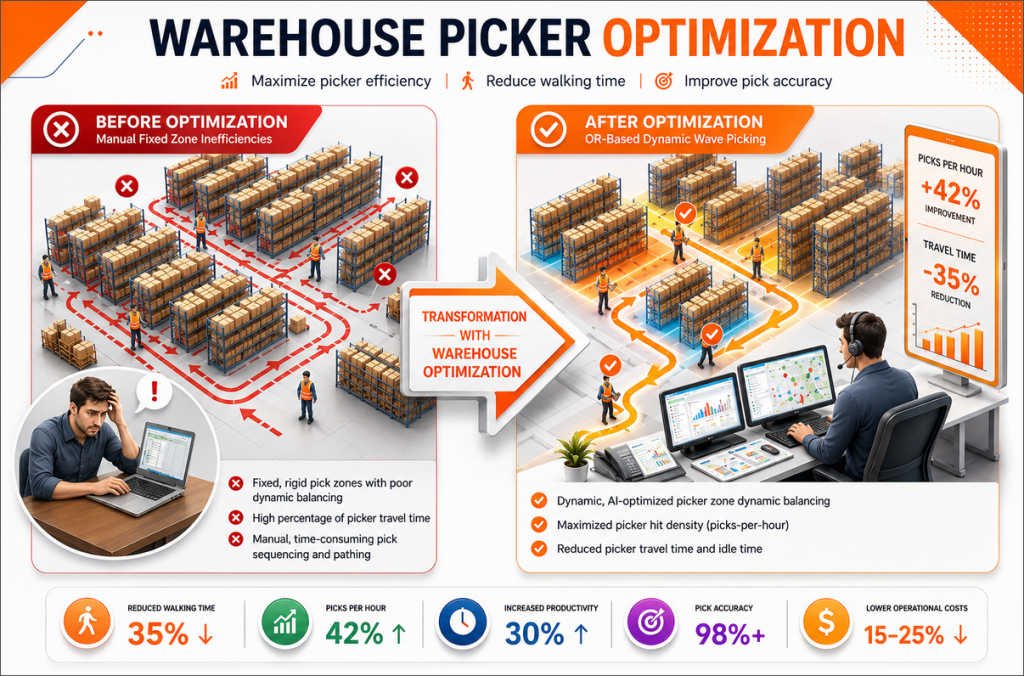
As the infographic illustrates, the difference between unoptimized intuition and mathematical precision completely reshapes physical reality, without moving a single warehouse shelf:
The Inefficient Baseline (Before Optimization): When relying on a traditional, fixed S-Shape routing policy, the warehouse floor quickly experiences invisible leaks in efficiency. Because pickers are bound to rigid, pre-set zones and full-aisle traversals, they end up walking the entire length of an aisle even if the required item is right at the entrance. The result? A massive penalty in redundant footsteps, high walking times, and an overwhelmed floor manager manually trying to balance incoming waves.
The Optimized Reality (After Optimization): By shifting to an Operations Research framework, we treat the exact same physical footprint as a dynamic network flow problem. The shelves stay where they are, but the logic changes. Instead of rigid zones, an Efficient Pick List algorithm dynamically groups items by layout proximity and picker capacity. Pickers follow calculated, non-redundant paths that maximize picker hit density (picks-per-hour), turning a manual maze into a fluid, data-driven symphony.
From Math to Code: Modeling with Python
As data scientists, we are used to calling .fit() and .predict(). In the world of Operations Research, the workflow is just as clean. Using Python optimization libraries like PuLP, we can translate our physical warehouse constraints into an executable mathematical model in just a few lines of code.
Here is a simplified look at how we model a single picker calculating the most efficient route across a set of target warehouse locations, directly embedding the exact step-by-step itinerary the solver outputs at the bottom for easy reference:
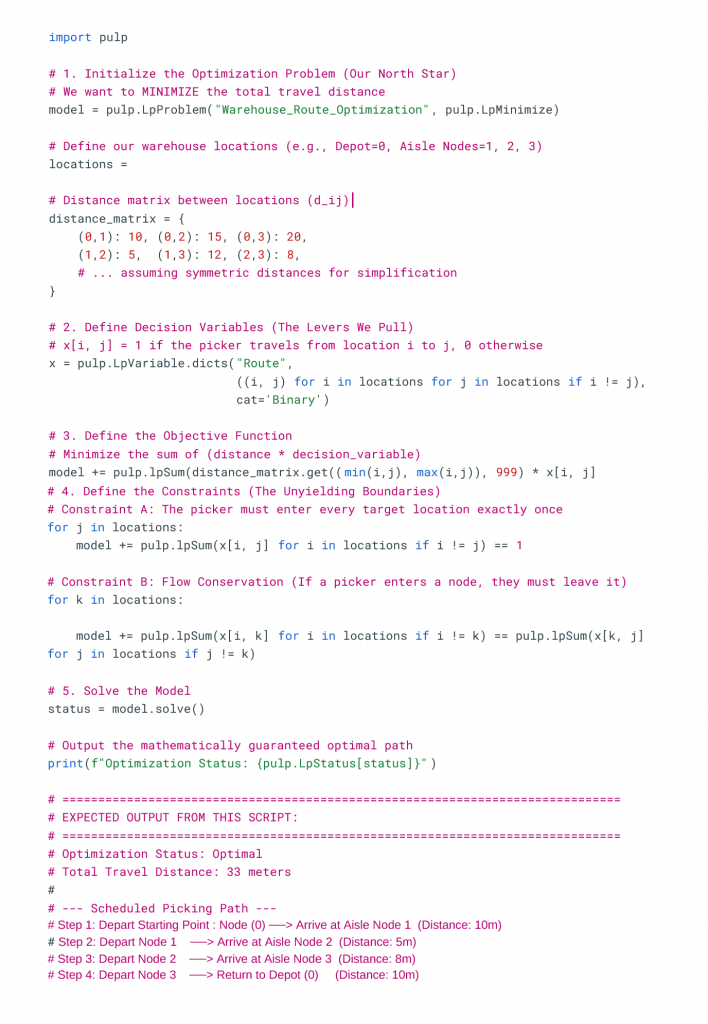
Look at how the variables changed under the hood. Out of all the possible combinations, the solver dynamically set our active path variables to 1 (True) and left the rest at 0 (False). Notice what is missing from the code above: there are no nested loops trying to manually guess the path. You don’t program the routing logic; you define the rules of the world, and the underlying math handles the rest.
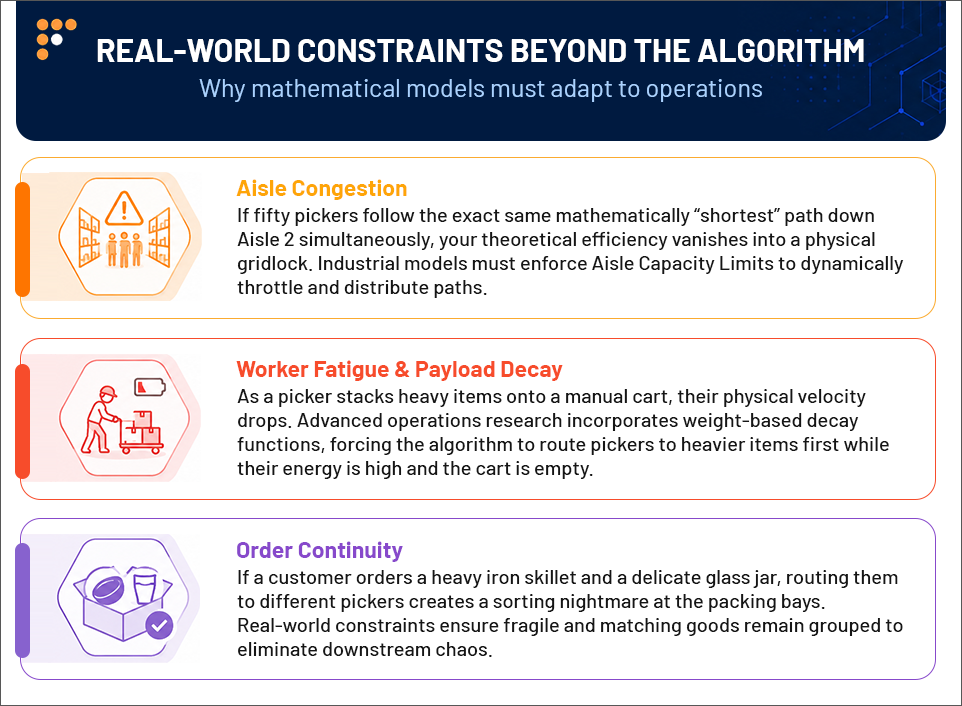
In the real world, the kind navigated by retail giants like Walmart and Amazon, pickers are not frictionless dots moving in a sterile vacuum. They are humans operating in a highly volatile physical ecosystem. To move from a textbook exercise to an industrial-strength application, an optimization model must evolve to face three brutal realities of the warehouse floor:
When thousands of orders flood a warehouse every minute, solving the math for every picker simultaneously creates a massive computational logjam. To beat the clock, industry leaders run a two-stage relay race called Cluster-First, Route-Second. First, Data Science takes the lead: machine learning models scan historical transactions to bundle frequently co-purchased items into optimal “macro-batches”.
Then, Operations Research closes the loop by passing these locked-in clusters to fast prescriptive algorithms. By treating the warehouse aisles as isolated networks, the system calculates the absolute shortest paths for those pre-made groups in mere milliseconds, shattering the computational barrier to deliver same-day shipping. When this combination of clustering and routing operates efficiently, the operational changes directly improve system performance. These improvements are measured using the following primary key performance indicators.
The Ultimate Business Scorecard
When an enterprise successfully bridges the analytical chasm by layering Operations Research on top of predictive data pipelines, the transformation shows up directly on the corporate balance sheet. Success is tracked through a set of tightly integrated Key Performance Indicators:
- Picker Hit Density: Maximizes the number of items retrieved per traveled meter, ensuring every foot stepped by a worker yields maximum product volume.
- Order Cycle Cut-Down: Drastically drops the time elapsed from a customer clicking “Buy” to a package hitting the shipping bay, directly satisfying strict same-day delivery SLAs.
- Cross-Functional Waste Reduction: Smooths out floor throughput, ensuring packing stations no longer sit idle waiting for delayed items and reducing outbound shipping truck queues.
Note – The ideas presented in this article are original except the editing part is taken care of by the frontier models.
Ready to optimize enterprise decisions? Discover how Factspan transforms data into measurable business outcomes with mathematical optimization.


The AI Scaling Framework for Production...

Building Governed Prior-Authorization Intelligence...

Production Readiness for Enterprise AI...

Engineering AI Token Optimization...

PowerCenter to IDMC: A Practical Migration Playboo...

AI Co-Engineer for the Data Engineering Lifecycle...

Building Scalable Data Pipelines with Alteryx and ...