As the phrase goes “History repeats itself – Events from the past can become events of the present.”
We recently saw this saying firsthand while resolving an issue for a Fortune 500 organization. The answer came in the form of genealogy maps. As we turned the pages of history to understand how relationships between the sales force affected things.
The representation of a multidimensional picture of sales data based on interactions and cause-and-effect linkages was a challenge for us. We were surprised by how genealogy maps are redesigned to address current business concerns.
Nothing has a greater impact on business today than the six-letter word “CHANGE.” Marketing, customer impression, satisfaction. A minor change in the pricing policy on a channel or new campaign can affect other aspects of the business. Because of the interdependence of businesses, leaders find it difficult to manage change because data limits their ability to make decisions. It is only available at a specific point in time AND at best, aggregated at several levels.
Tracking Efficiency with Genealogy Maps
Take John, a highly ambitious regional sales leader for a Fortune 500 business that sells B2C wellness goods, as one example.
John is in charge of 50 independent consultants, 50 AMs, and 50 DMs who are tasked with selling a recently launched product. John often bases his decisions on Excel dashboards, which display the overall performance of his portfolio over time and, at its best, broken down by his direct reports.
Frequently, he is left in the dark about issues like “What is the product mix sold by various employees in my team?” and “Where do various team members require assistance?” and is limited in his ability to judge each person’s performance on an equal playing field.
Handpicked Content
Dive into the world of offset management and its crucial role in business operations. Explore Offset Management and Its Significance to gain valuable insights and optimize your organization’s efficiency

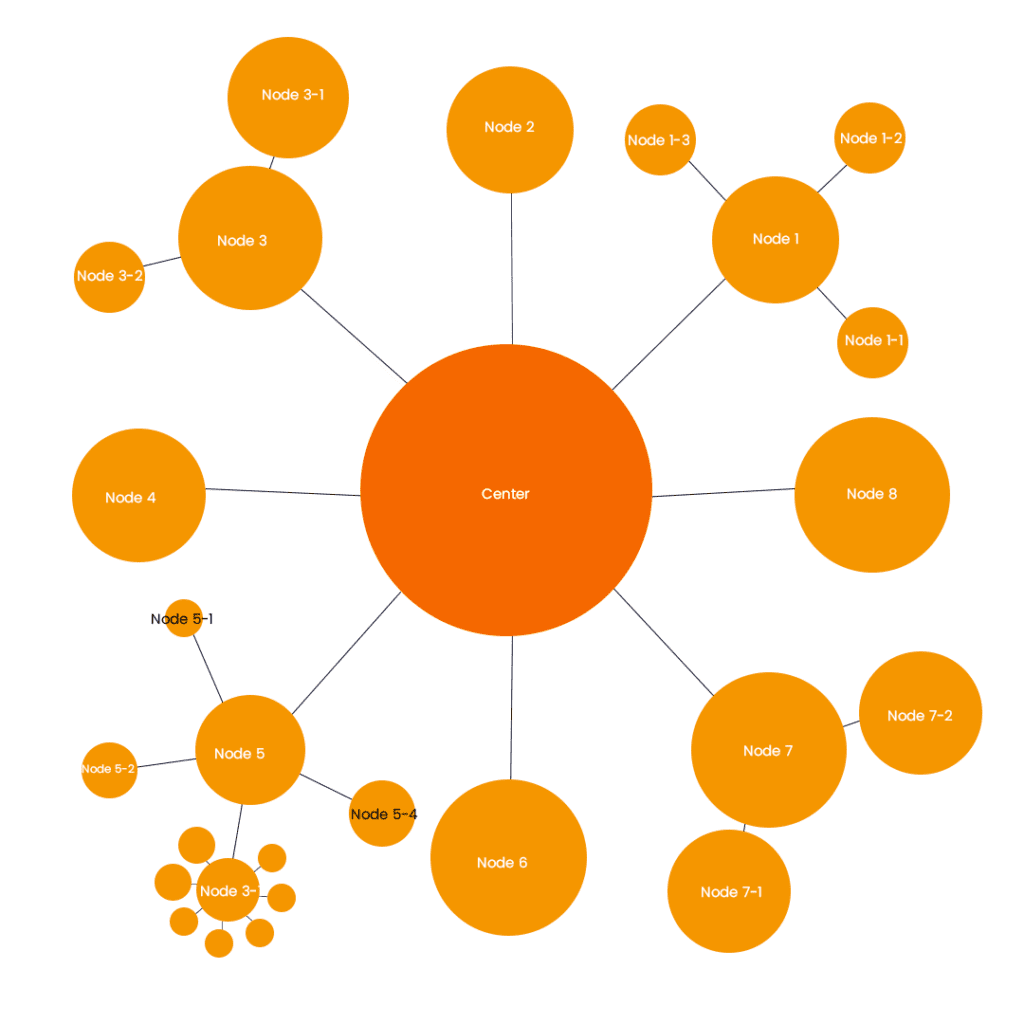
Genealogy maps, or the “study of families and the tracking of their lineages and history,” can help thousands of decision-makers. Like John accelerate change by examining the performance of every member of their team on an equal footing and assisting in the identification and remediation of problem areas. Genealogy maps assist us in tracking not only sales but also supply chain, employee utilization, marketing, and finance. A wide range of intriguing questions like
- What is the efficiency of multiple warehouses in my supply chain distribution network?
- How has the utilization of my team members changed over time?
- How do various campaigns affect different functional units of my business?
To meet various professional and individualized use cases, from identifying and mapping family ancestry to detecting multi-level sales force effectiveness, Tableau provides functionality to generate a number of complex custom visualizations, including a variety of genealogy maps.
Business Use Cases
- Using topic classification, which breaks down customer themes (like product satisfaction, costing, and availability) into topics and subtopics (Product features -> Multi click functionality, Multi payment methods; High costs -> No discounts, bad bundled offers), can help a US retail giant better understand user sentiment on a variety of products so that they can take appropriate action.
- Breaking down B2B products into the various inventory classes they fall under (Desktop PC -> Monitor accessories, CPU accessories, etc.), further separating them into sub-classes and components, and tracking availability across various service centers (CPU Accessories -> Graphics cards, RAM/Memory, Hard Drive), RAM/Memory -> 4 GB DDR, 8 GB DDR, etc.) can help a technology company better track and regulate spare parts inventory.
A use case is an expression of viewpoints seen via a lens. Once you begin looking at different business issues via this lens, you’ll see how easily this can speed up various analyses you’ve been doing. BI solution vendor Tableau specializes in producing interactive data visualizations. Their ability to offer personalization on every aspect of their visualization. In addition, giving complete data blending capabilities—reduces the time it takes to find latent insights and, as a result, fosters actionability.
Tableau Dashboards for enhanced Healthcare Analyti...
Tableau Vs Looker: Who can Win the B.I Battle?...