Tableau and Looker are two of the in-demand self-service business intelligence products that help companies better visualize and understand their data.
On one hand, Tableau where users can easily hook up with data stored nearly anywhere and in nearly any format; the latter which is Looker has been a powerful data analytics platform that can help both large and little companies glean value from their data. Both are idolizing their feature in a unique way.
If we focus on the major know-hows of both the tools, some differences can be worth mentioning.
Looker for instance,
- Makes collecting, visualizing and analyzing data a lot easier.
- It is browser-based and offers a singular modelling language. It is straightforward to use.
Whereas Tableau,
- Makes it easy to settle on, customize, and make a spread of interactive visualizations, providing a spread of graphs and charts to settle on from.
- Makes in possible to create interactive dashboards with advanced visual analytics through a haul and drop feature.
And so much more that we are going to understand in detail in this article. Look closely as it might help you in choosing the right B.I Tool for your business needs.
What’s the Criteria to Choose?
An organization must consider the following factors before choosing between Looker and Tableau:
- Your current system infrastructure
- Company size
- Data Analytics needs
- Storyboards, graphs, and chart formats that are most effective for interacting with your team
- Types of access you’ll require, whether local or cloud-based storage is available on that platform
Who will Win the B.I Battle: Tableau Or Looker?
DATA MODELING
Tableau has snowflake and dimensional data models to analyze a large volume of data. These data models are used in a data warehouse to integrate the data with different sources and help to improve the performance of analytical queries.
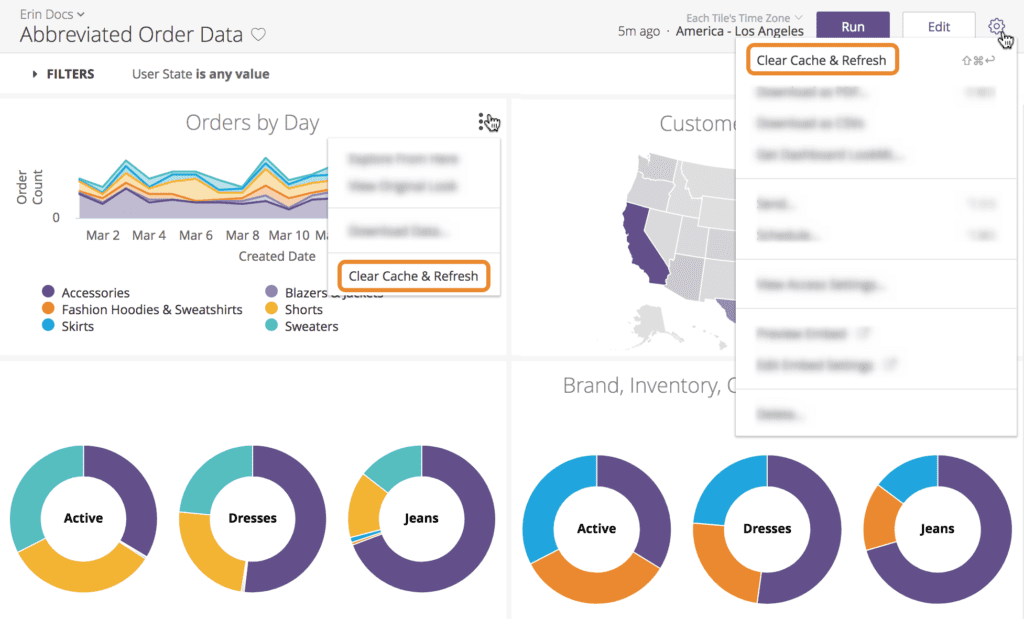
Whereas, Looker provides LookML data model which is powerful, reusable and flexible. LookML provides analysts with sophisticated tools to build high-end analytics and it is the replacement for SQL because SQL is not reusable and flexible.
REPORTING
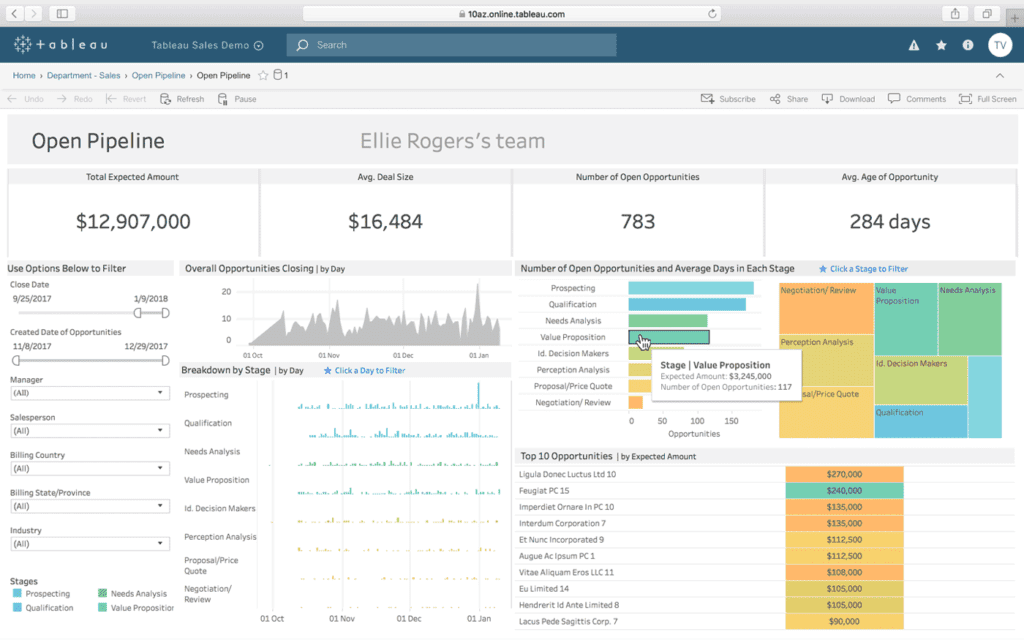
Tableau is the best tool to create reports. You can prepare the customized reports according to user requirements. Tableau uses extensive connectors and fast authoring environment to create and publish dashboards and reports in multiple output formats.
Looker provides standard reporting templates to the user. Users can create reports quickly and efficiently by using standard templates. Looker enables ad-hoc reporting to build custom reports according to user specifications.
SPEED
Tableau allows users to build interactive and effective visualization reports within moments. You can make the entire process fast and easier because it will enable you to share the reports online and offline.
In processing the data and creating the reports, Looker is slow when compared to Tableau. It takes hours to share the reports with the user.
BIG DATA INTEGRATION
Tableau data sources include Cloudera Hadoop, Oracle, AWS Redshift, Teradata, Microsoft SQL Server and many others, accessible through the software’s web data connector and APIs.
Governance and security measures are included in the system, but Tableau can also integrate with security tools already in place, such as Active Directory, Kerberos and OAuth. Tableau has the advantage in the category of big data integration. The software incorporates security control features, offering the added benefit of compliance assurance and secure data sourcing.
While, Looker accesses Amazon Redshift, Google BigQuery, Snowflake, Git and other sources to extract data. The program’s LookML functionality breaks down data, adjusts for changes and organizes files.
INTEGRATION
Tableau integrates with a broad range of data sources like CSV, spreadsheets, SQL databases, Google Analytics and many more. It also connects with the R to provide control to the analytical tools.
On the other hand, Looker is an open API to integrate with SQL database and third-party applications such as Green plum, Amazon Athena, etc. Looker has excellent extension features that allow the user to work with other products and systems.
DOCUMENT MANAGEMENT
Tableau has the ability to export reports in the form of PDFs, spreadsheet files, images, crosstabs and more. The program’s extensive formatting options allow for easy sharing and collaboration.
Meanwhile, Looker converts reports into TXT, CSV, JSON, HTML and PNG formats as well as Google Spreadsheets and Microsoft Excel for the creation of data charts. Looker users can allow public access on reports and control viewing privileges.
CONCLUSION
You’ll notice the tools share similar document management functionality when comparing Looker vs Tableau. Both systems are able to convert reports into different formats and distribute the files easily. In the category of document management, Looker and Tableau reach a tie.
In terms of pricing, Tableau and Looker both provide different subscription plans to users plus a free trial version. Prices vary depending on deployment and version of Tableau.
