
Executive Summary
A leading retail enterprise aimed to drive better visibility into delivery performance across portfolios, domains and teams. The absence of a centralized performance view made it challenging to align stakeholders, optimize operations, and proactively resolve bottlenecks.
Factspan built a multi-layered Unified Performance Dashboard that provides targeted insights across organizational levels. By enabling real-time visibility into key metrics, the dashboard empowered leadership to make informed decisions, streamline processes, and foster a culture of accountability and continuous improvement.
About the Client
The client is a global retail leader with a vast portfolio of stores and digital channels. With distributed agile teams and a strong focus on innovation, the organization needed an efficient mechanism to track, assess, and improve delivery outcomes across multiple business units.
Business Challenge
The client faced challenges in monitoring delivery performance due to fragmented reporting systems and inconsistent KPI definitions. As teams scaled, the lack of a unified view made it difficult for leaders at different levels to identify underperforming areas or measure progress objectively.
The organization needed a solution that would offer high-level insights to executives while allowing deeper drill-downs for operational teams. A consistent, visual framework for tracking metrics like cycle time, velocity, delivery accuracy, and defect density was essential to support better planning, execution, and governance.
Our Solution
Factspan collaborated closely with stakeholders to develop the Unified Performance Dashboard, a scalable solution tailored to support decision-making across organizational layers.
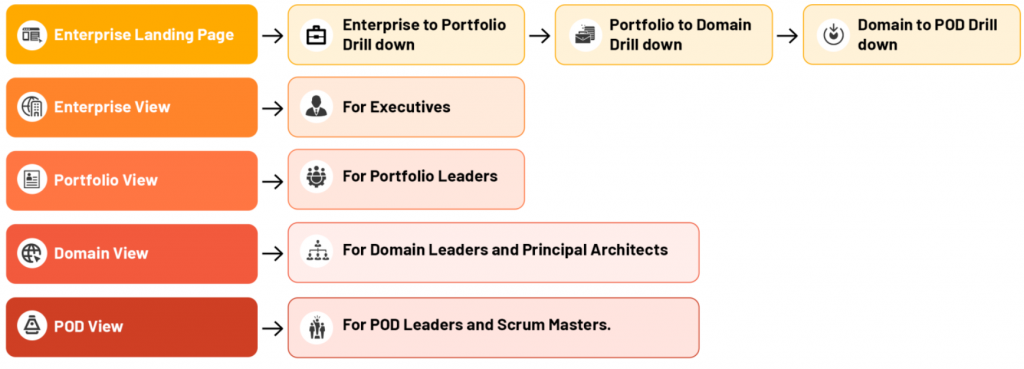
Layered Insight Architecture: The dashboard was structured to serve distinct leadership tiers, CXOs, portfolio managers, domain leads, and team-level contributors. Each user tier received curated performance views aligned to their responsibilities.
By automating tracking and structuring data analysis, the system accurately processed opt-in changes, minimizing manual effort and improving data reliability. Advanced reporting features provided business teams with actionable insights, enabling them to make informed decisions and optimize engagement strategies.
Key KPI Tracking: Four core delivery metrics that included Four core delivery metrics, i.e.,Delivery Pace Variance, Epic Completion Time, Commitment vs. Delivery Ratio, and Quality Defect Rate, were standardized and visualized. These KPIs offered a balanced view of speed, accuracy, throughput, and quality.
Interactive Drill-Downs: Users could interactively explore quarterly trends, compare performance across timelines, and investigate portfolio health. Underperforming areas were highlighted through threshold-based visual cues, enabling rapid root cause analysis.
Actionable Data Flow: The dashboard facilitated drill-downs from portfolios to domains and pods, enabling proactive issue resolution. For instance, leadership could identify specific pods underperforming within a red-flagged domain, trace delays, and implement corrective actions.
By integrating relevant KPIs into a centralized, intuitive platform, the dashboard improved transparency, helped drive accountability, and reinforced a performance-first culture across the organization.

Dashboard Drill Downs:
Business Impact:
- 25% boost in delivery accuracy tracking
- 30% faster issue identification across pods
- 40% increase in agile team efficiency
- Organization-wide KPI visibility and alignment
- 80% reduction in Manual work
Featured content

Operational Data Platform Implementation...

Scaling Licensing Revenue Operations for...

Agentic Test Automation for QA Accelerat...

Fast‑Tracking Cloud Migration of Legac...

Data & BI DevOps Modernization for a...

Enterprise Cloud SRE Modernization for a...

Log Unification & Cross-Cloud Observ...

Optimizing Theme Park Operations with Re...

Modernizing DataRobot Models on Google C...