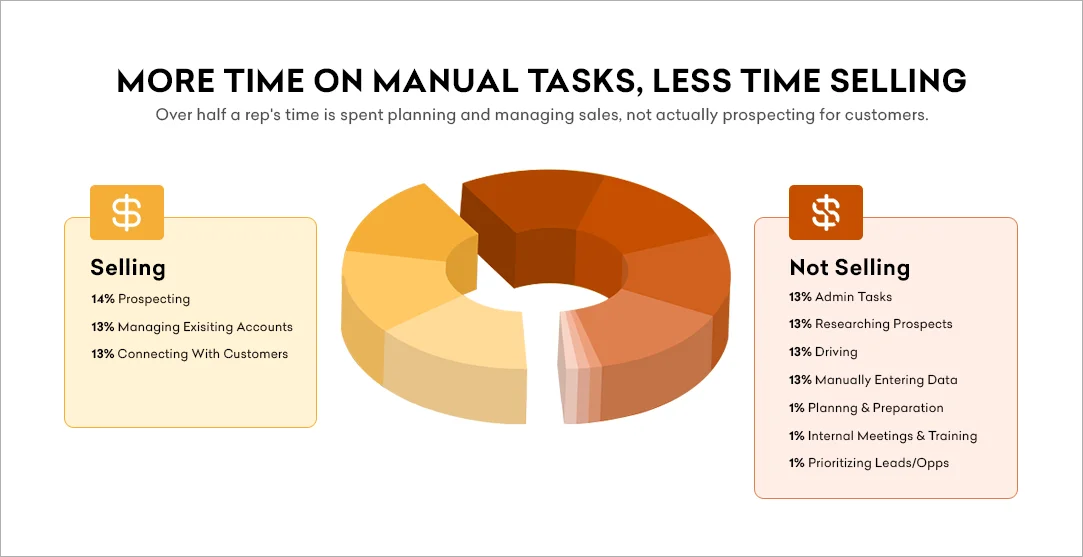
Do you know? A sales representative only spends 39% of their time really selling or communicating with prospects and customers. To boost sales productivity and performance, the task has not been easier moreover, it has even grown to be a more difficult roadblock.
Let us discover and see in detail what are some of these complexities and how Factspan solved for them.

Problem Statement
A key player in Infrastructure Performance Management arena (> 100MM in revenue) wanted to optimize time invested in pipeline generation, guided selling, monitoring pipeline quality and more than anything wanted to optimize time invested by CEO on sales teams’ weekly business review (which would go for 1-2 hours on average)
- Sales professional B2B productivity has been plummeting to all-time lows of less than 33% productivity time
- Already at a focus disadvantage, over 30% of sales professionals suffer from attention deficit disorder.
The VP of sales operations and CEO had identified certain themes that they wanted to build solutions for in order to boost sales productivity. These themes were triggered by the nature of conversations they would have in WBRs. Some of the themes were as follows:
1. Overall picture of the pipeline
2. Goals and gaps
3. Progress over time
4. New v/s Old business
5. Rep performance
Main Areas of Concern
The company was using the vanilla version of Salesforce for logging and tracking its opportunities and funnel. Salesforce gave them a solid platform to build reliable, error-free data but it did not provide a reporting platform, robust enough to answer all the above questions. Some of the challenges were:
- Tracking gut alignment between VP and Reps
- Tracking week over week changes
- Building views specific to current quarter
- Defining and tracking aging pipeline
- Difficult cross-object reporting
- Integrating with other data sources
Our Solution
The meta point here is, there is a huge need to boost sales team’s productivity in a noticeable way so that they can focus on what is important – Customer experience and Success.
Though the gravity of the problem is huge, simple data driven solutions can help solve these problems to an extent. One of the key aspects as we understand at Factspan is to produce relevant information for your sales teams which in turn reduces their time invested in administrative tasks.
#1 Solving with Right Data Engineering

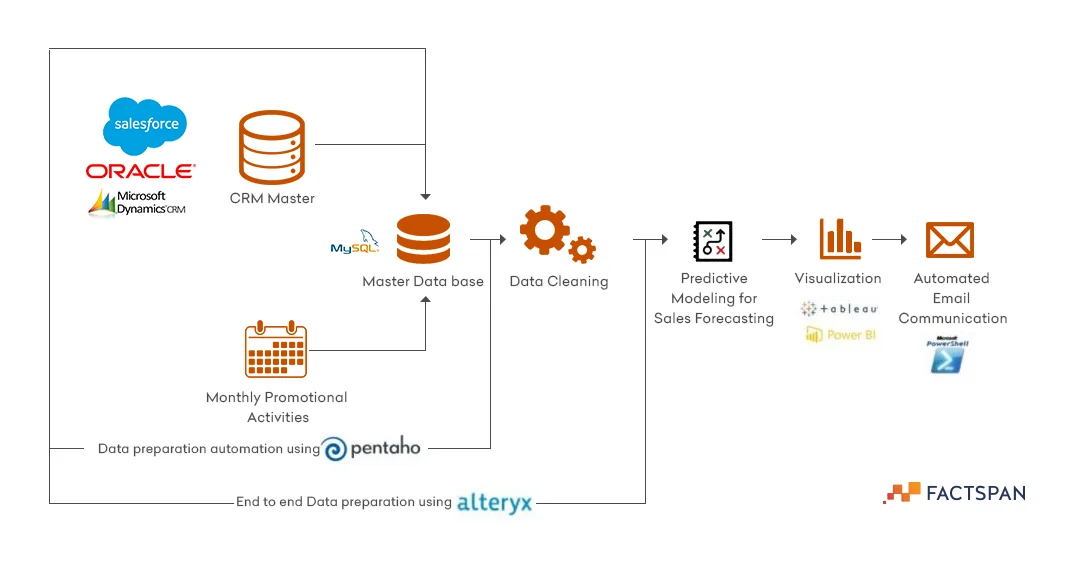
One of the key aspects to address the above problems was to get the feed of Salesforce data on a platform which give us flexibility to manipulate, integrate and blend data, define newer variables and build report on top of that. ETL tools like Alteryx, Pentaho, Hadoop were top choices to get this data feed into SQL databases.
The diagram shows overall technology stack that we have been using at Factspan for solving problems articulated in earlier section.
For this use case, we used Pentaho for all following purpose:
1. Fetch Salesforce data into MySQL in an automated & periodic way
2. Blending it with bookings data and marketing data
3. Archiving the data on weekly cadence
5. Molding the data in a format which is readily usable by Tableau
#2 Solving with Right Data Visualization
The key to increasing sales team’s productivity is to present the relevant and actionable data. With the help of Pentaho, we were able to get the download of data from Salesforce to MySQL. The next logical step was to build a visually intuitive and business relevant report. The tool of choice for the company was Tableau. Let’s look at the funnel view which eventually optimized sales team’s productivity.

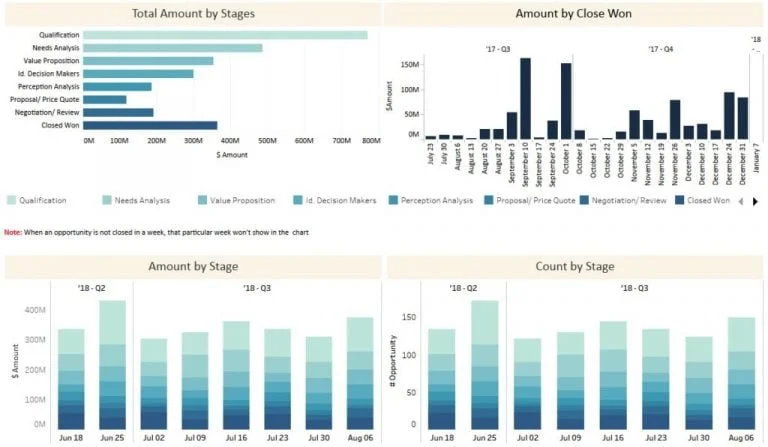
View 1: Executive view of the funnel
This view was essential for executives to understand at a glance, how the overall pipeline is looking like and how much business the sales team is closing week over week. The gradient color pattern for different stages made it possible to understand the trend for each pipeline stage and build different strategies to drag more sales to the bottom of the funnel.

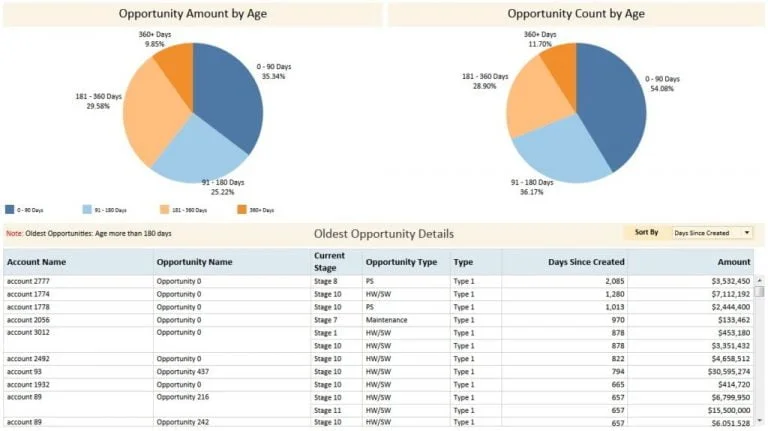
View 2: Age of Pipeline
The above view answers one question for sales regional managers – how old is your pipeline? This not only helps them adjust their gut values for the quarter, but it also helps strategize the next move for the team. The table below gives high level information about each of the opportunity and one can click on the opportunity name to hope on to the Salesforce page of that opportunity.
Results and Impact
This solution was well received by entire sales team. It helped executives and sales team to track more interesting outcomes like:
- Auto archiving and retrieval: The auto archiving made it possible to go back in time and have a look at pipeline or any other view for any past date. This was crucial for calculating incentives for representatives at the end of the year.
- Auto email and fast refresh cycles: All the reports would refresh every 3 hours; thus, everyone was always looking at latest data. Every Sunday evening, the latest snapshot of the entire dashboard would be sent to all the executives and that would then become center piece of the entire WBR
- Data Abstraction: The data abstraction allowed reps to see only their own funnel. VPs could see funnel for only their own region and executives could have a look at all the data. The interesting part here was, there was no dashboard replication; the data abstraction was built on top of single dashboard.
- Standardize the discussions they would have in WBR
- Focus more on customer experience and success than building presentations for WBR
- Spend more time on strategizing and focusing on keeping pipeline healthy
Featured content

Automating Oncology Intake with AI-Power...

Structuring Quality in Enterprise Softwa...

Intelligent Pharmacy Benefit Simulation ...

Modernizing Health Claims Analytics with...

Choosing Polars Over Pandas for High-Per...

Improving Enterprise Agility with a Unif...

The Future of Medallion Architecture wit...

SMS Opt-In Analysis for Customer Engagem...

Enterprise-Grade Automation for Data Pip...

