
In the movie Matrix reloaded, The Architect of Matrix explains to ‘neo’ what he is. “ You are the eventuality of an anomaly, which despite my sincerest efforts I have been unable to eliminate from what is otherwise a harmony of mathematical precision. While it remains a burden to sedulously avoid it, it is not unexpected, and thus not beyond a measure of control.”
‘The problem’ of this era is neither the scarcity of data nor the means to analyse it. We have blazed a path over last decade or so that we have moved to the other end of spectrum, we are being overwhelmed by it. In the world of automation and machine learning there is still a Digital campaign manager who is spending his entire day shifting through 100s of these automated reports trying to make sense out of the numbers. Since one have put lot of effort in making sure that these automations are correct, and expectedly so, almost no attention goes over validating these numbers in the report. But anomalies occur, it is inevitable.
So, if the architect found it impossible to avoid these anomalies so would you and me and hence let’s focus more on identifying them.
In this article we shall focus on how to find anomalies in a time series data.
Anomaly detection problem for time series is usually formulated as finding outlier data points relative to some standard or usual signal. While there could be many types of anomalies, in a time series we would most commonly associated them to a spike or a drop or an unexpected trend.
Types of anomaly:
1. Additive: A sudden data breach happened and as a data security company you saw a huge spike in short period for new bookings. These types of anomalies are called additive.
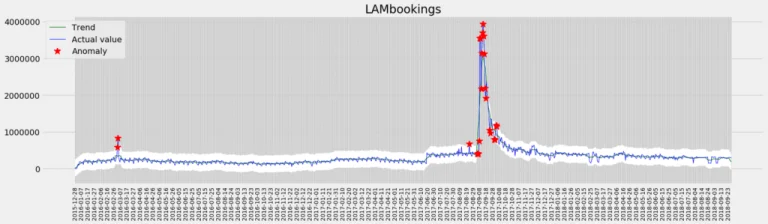
Fig 1: Additive anomaly
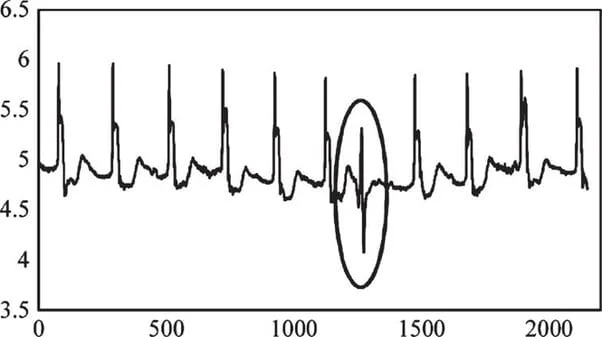
2. Temporal: Your attribution engine went down and there was zero or very low numbers reported for your sales through some channels for some small period. These types of anomalies are called Temporal.

Fig 2: Temporal anomaly
There are basically two ways you could detect anomalies either label each point as anomalous or normal or predict the normal range for each time point and see the data fits into that range or not. In the second approach we are better setup to visualize a confidence interval and find the reasons for anomalous occurrences.
The simplest approach to identifying irregularities in data is to flag the data points that deviate from common statistical properties of a distribution, including mean, median, mode, and quantiles. Let’s say the definition of an anomalous data point is one that deviates by a certain standard deviation from the mean. Traversing mean over time-series data isn’t exactly trivial, as it’s not static. You would need a rolling window to compute the average across the data points. Technically, this is called a rolling average or a moving average, and it’s intended to smooth short-term fluctuations and highlight long-term ones.
These are the few algorithms we tried
1. STL decomposition
STL stands for seasonal-trend decomposition procedure based on Loess. This technique gives you an ability to split your time series data into three parts: seasonal, trend and residue. It works on seasonal time series.
It used median absolute deviation to get a more robust detection of anomalies.

Fig 3: Decomposing time series data in Seasonal, Trend and Residue
2. Classification and Regression Trees
1. Supervised: we used supervised learning to teach trees to classify anomaly and non-anomaly data points. the output from Moving avg methodology was taken as an input to train the model.
2. Unsupervised: Second approach is to use unsupervised learning to teach ML model to predict the next data point in your series and have some confidence interval or prediction error as in the case of the STL decomposition approach. You can check if your data point lies inside or outside the confidence interval using Generalized ESD test, or Grubbs’ test.
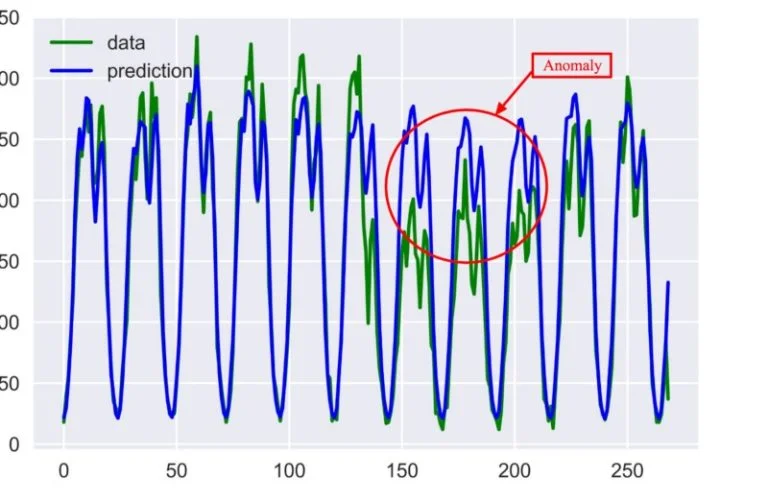
Fig 4 : Comparing Predicted vs actual to identify anomaly
3. Neural Networks: Recurrent Neural Network was used for anomaly detection, where the model keeps the temporal data points in memory and uses it to learn about time-dependent structure in a series of data.
RNN looks for the pattern in after every periodic shift and compares with the patterns in the historical data to find the anomalous pattern even if the point in time values are in range.

AI Co-Engineer for the Data Engineering Lifecycle...

Operational Data Platform Implementation for a Glo...

Building Scalable Data Pipelines with Alteryx and ...

Scaling Licensing Revenue Operations for a Global ...

Agentic Test Automation for QA Acceleration Using ...

An Enterprise Framework for ROI-Driven Agentic AI...

Fast‑Tracking Cloud Migration of Legacy Assets w...

Fractional AI and the Future of Enterprise GenAI S...

Multi-Agent Healthcare Ecosystems for Smarter and ...