
Why this blog?
Raw metrics don’t drive outcomes, context does. This blog explores how to move beyond disconnected dashboards and build a unified quality framework that engineering teams can trust and leadership can act on. By tying together signals from code to production, the scorecard approach helps shift quality from reactive checklists to proactive strategy. For organizations scaling fast, this isn’t just a reporting fix, it is a foundation for engineering maturity.
Software quality is one of those things everyone claims to care about, but few can actually measure well. Across industries, engineering teams track a wide array of metrics: test coverage, defect rates, velocity, uptime. But these metrics are often siloed, interpreted inconsistently, and disconnected from each other.
The challenge is structural. Quality signals live in Jira, GitLab, Xray, ServiceNow, Dynatrace, Splunk each excellent at what it does, but not designed to offer a unified perspective. As a result, organizations end up optimizing in fragments. One team speeds up cycle time while another sees an uptick in production errors. Leadership sees charts, not clarity.
What’s needed isn’t more data. It’s a framework that connects the dots.
When Metrics Drift Away from Meaning
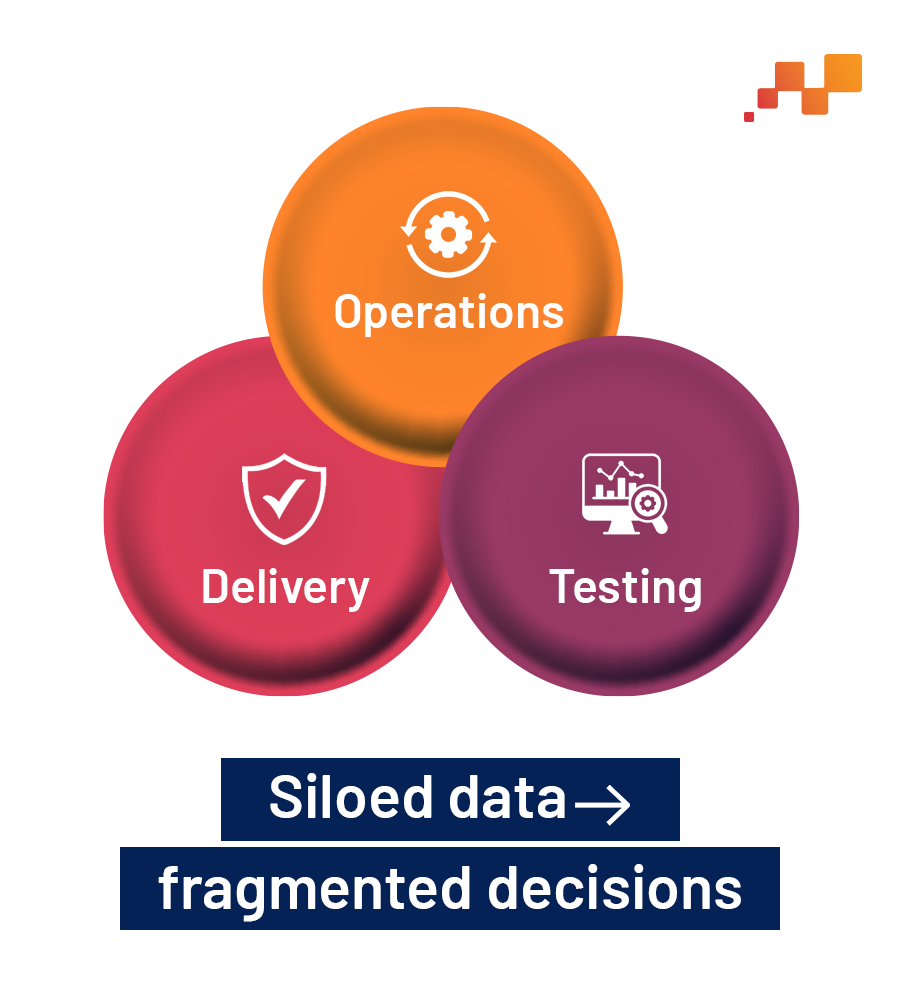
In most enterprise environments, software delivery and operations data is generated across an ecosystem of tools. Each provides narrow but critical insights, Jira for backlog and sprint health, GitLab for code changes, Xray for test performance, ServiceNow for incident management, and so on.
Yet, these systems don’t naturally talk to one another. This makes it difficult to answer cross-functional questions like:
⇒ Are we detecting bugs earlier in the development lifecycle?
⇒ What’s the tradeoff between faster release cycles and incident frequency?
⇒Which teams show consistent delivery patterns across sprints?
Without a shared view, engineering teams rely on anecdotal retrospectives and reactive firefighting instead of deliberate improvement.
When Scorecards Become Thinking Tools
Rather than layering more dashboards or KPIs onto already complex workflows, the scorecard method introduces structure and synthesis.
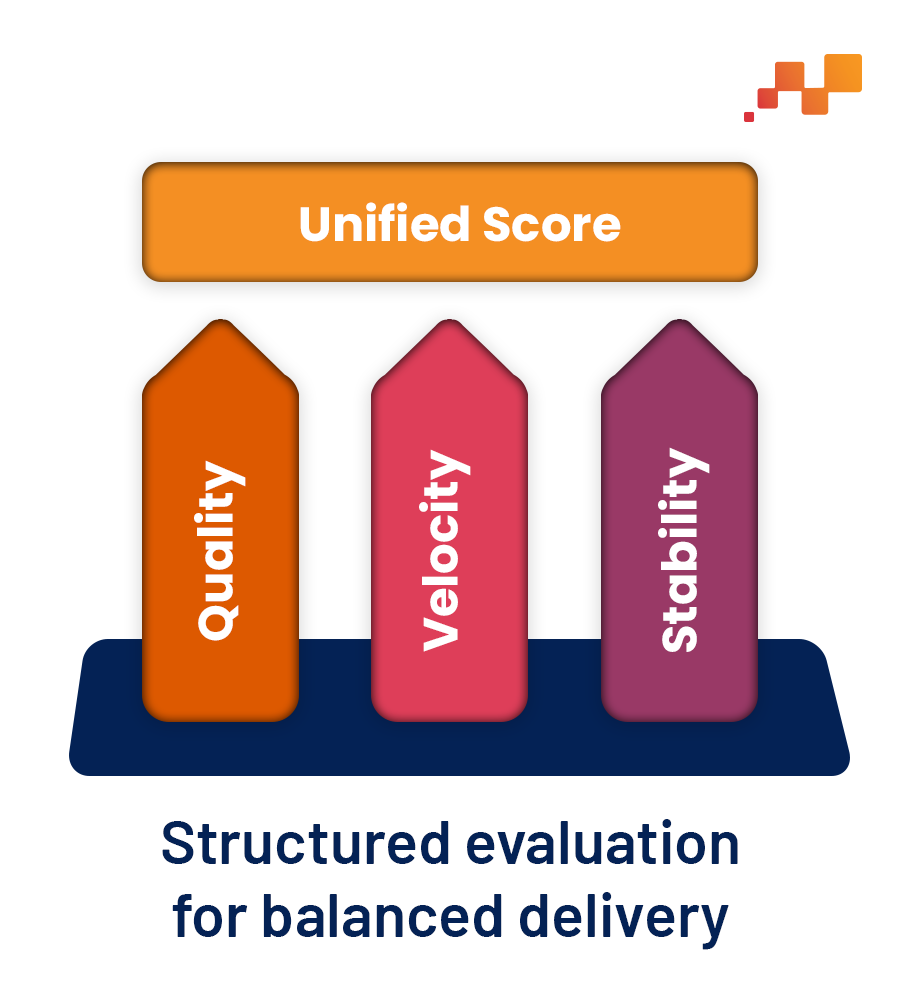
This approach organizes quality-related signals into three core dimensions:
Quality: Measures that reflect software correctness and robustness, like defect density, test traceability, and issue recurrence.
Velocity: Indicators of throughput and delivery health, such as cycle time, merge frequency, and release predictability.
Stability: Runtime and operations metrics, error rates, deployment failures, incident resolution time.
Designing a System That Connects the Right Metrics
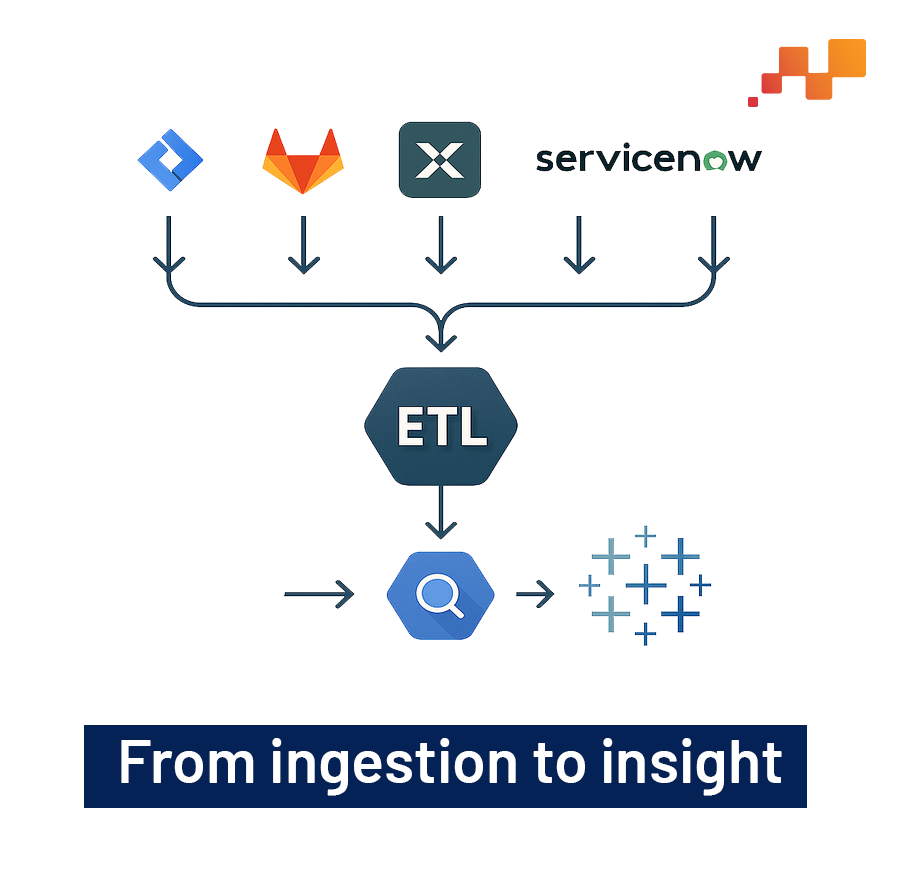
Implementing a scorecard system requires building robust data pipelines. This often involves integrating APIs from delivery and operations tools to collect structured data into a warehouse like Google BigQuery.
Key sources might include:
Jira – Story point burn-down, issue cycle times
GitLab – Commits, pull request velocity, change volume
Xray – Test coverage, pass/fail rates
ServiceNow – Incidents and resolution paths
Dynatrace/Splunk – Runtime performance, error trends
Once collected, this data can be modeled into unified metrics, which can then be visualized using tools like Tableau, offering traceability and comparability across functions.
What Scorecards Explain, and What They Don’t
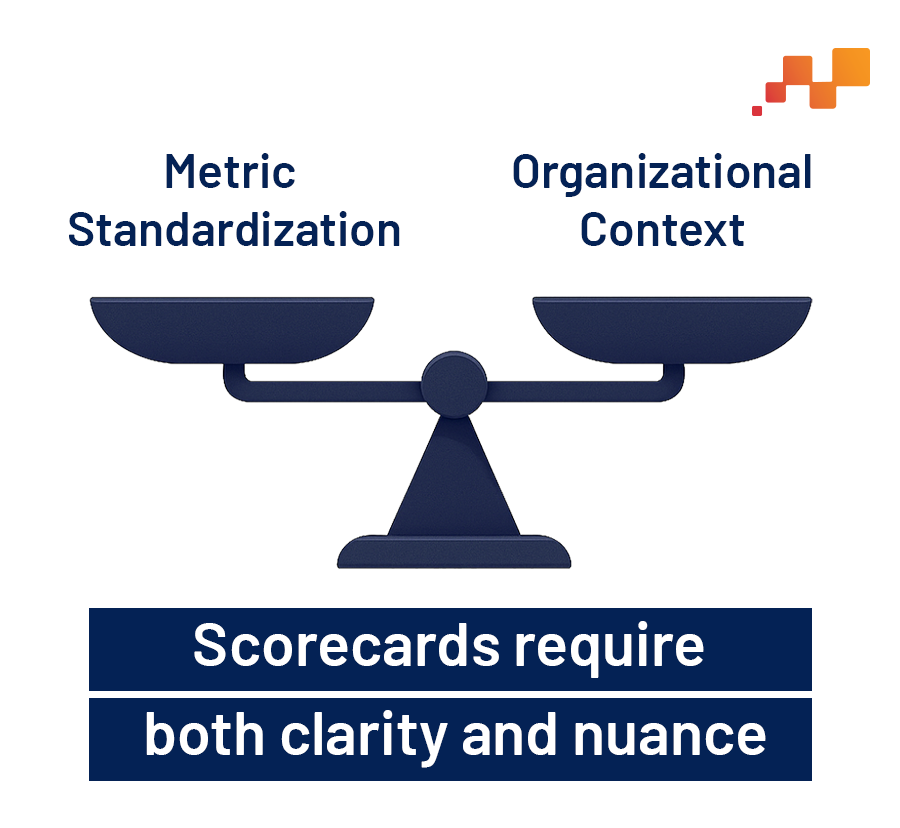
What makes scorecards powerful is also what makes them hard to get right.
Defining metrics that are both standard and meaningful across teams requires deep alignment. Metrics must be trustworthy, non-punitive, and contextual, otherwise they risk turning into vanity charts or team performance scoreboards. But when implemented thoughtfully, scorecards introduce visibility. They help spot anomalies before they escalate. They provide common ground for retrospectives. And they make quality a shared, observable system rather than a vague aspiration.
But what does this clarity actually look like in practice? To make software quality truly observable, the scorecard must answer the right questions for the right people, each with distinct goals, blind spots, and decisions to make.
So, Who Needs the Scorecard? What Can it Answer for them?
A single dashboard, no matter how well-designed, is only as powerful as the questions it helps answer. To break down silos and deliver instant clarity, the scorecard is built to address the million-dollar questions each stakeholder in the development process faces daily:
⇒ QA Lead
- Are our tests catching regressions early enough?
- Which modules have recurring failures despite high test coverage?
⇒ Engineering Manager
- Is our delivery velocity improving without compromising stability?
- Which teams are struggling with high issue reopen rates?
⇒ DevOps Head
- How frequently are deployments causing incidents?
- Are we resolving production issues faster sprint over sprint?
⇒ Product Owner
- Are feature delivery timelines improving?
- Which parts of the product are bottlenecks due to poor quality signals?
⇒ CXO / Portfolio Head
Are our software investments aligned with business outcomes?
- Which portfolios are delivering consistent value and which ones are bottlenecked by delivery or quality risks?
- Where should we allocate budget to accelerate high-performing streams or stabilize underperforming ones?
Making Software Quality Observable, Not Just Absolute
This ability to deliver role-specific insights is what elevates scorecards from reporting tools to strategic assets. Software quality can no longer remain an abstract ideal, especially not in fast-paced enterprise environments where code is both product and infrastructure. The true shift lies in making quality observable, structured, and actionable.
A well-designed scorecard doesn’t just measure what teams did, it reveals how they’re evolving. It highlights patterns, flags inconsistencies, and creates a shared language between engineering and leadership. Over time, it turns software quality from a reactive fix into a continuous, data-informed discipline.
As teams scale, the competitive edge won’t come from writing more code, it’ll come from understanding what that code means, how it behaves in production, and how reliably it serves the business. The future of software belongs to those who can see it clearly.
In essence, building smarter scorecards isn’t just a reporting exercise, it’s a cultural shift toward engineering with intent. If you’re aiming for software that’s fast, stable, and built to last, it starts with measuring what truly matters.
Ready to make software quality measurable, visible, and actionable?