
Designing BI Dashboards for Real-time Healthcare Analytics
In the healthcare domain, a commitment to pushing the boundaries of data-driven innovation has been evident in the recent decade. AI, for one, has completely transformed how data is screened to extract meaningful insights. At the core, it has empowered healthcare leadership. The transformation has proved to be a powerful data visualization tool, enabling the creation of comprehensive executive dashboards tailored to incorporate various aspects and Key Performance Indicators (KPIs). These dashboards serve as a guide, empowering visionary leaders to navigate the complexities of modern healthcare effectively.

HCA Virginia Commonwealth University Health System
HCA Virginia Commonwealth University Health System (HCA VCU Health) is a large, integrated healthcare system serving the greater Richmond, Virginia, area. The HCA VCU Health system has been using data and AI dashboard to track and improve patient care for several years. The dashboard provides real-time data on a variety of metrics, including patient safety, quality of care, and resource utilization.
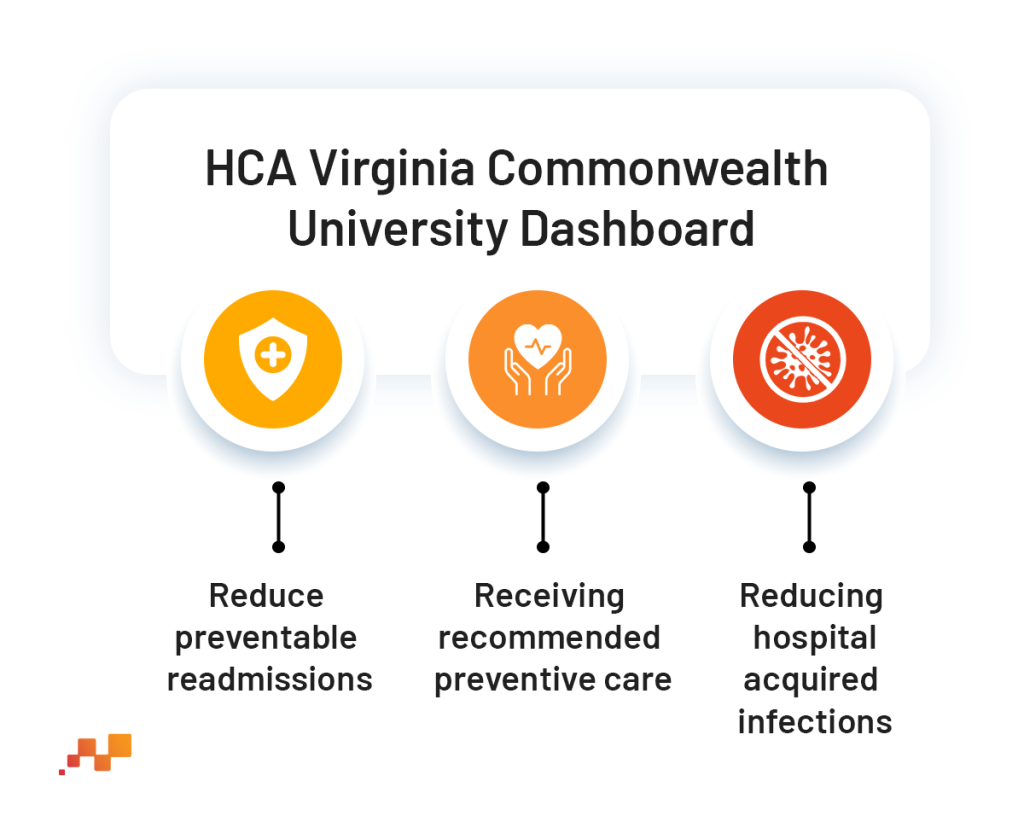
Reduce preventable readmissions: The health system has used data information to develop a new program to reduce readmissions. The program has been successful, and readmission rates have fallen by 20%.
Receiving recommended preventive care: The health system used real-time information to develop a new program to increase the use of preventive care. Through the program, the rates of preventive care have increased by 15%.
Reducing hospital-acquired infections: The health system used the information available to realize the issue of reinfections and develop a new program to reduce hospital-acquired infections. The program has successfully lowered the rate of hospital-acquired infections by 30%.
The data and AI dashboard has been a valuable tool for HCA VCU Health. It has helped improve patient care, reduce costs, and improve the quality of life for its patients. HCA Virginia Commonwealth University Health System is just one of many examples where a dashboard has been tailored to a particular healthcare system to identify and address several issues.
Empowering Healthcare Visionaries
Most healthcare providers recognize the pivotal role of data-driven decision-making in their field. They equip the leadership team with the tools needed to navigate the complexities of modern healthcare effectively.
The Power of Executive Dashboards
The creation of executive dashboards, which act as the nerve center of real-time insights, provides immense benefits. These dashboards offer a holistic view of critical areas, including physician productivity, consumer access, surgery utilization, and more. Let’s delve deeper into the rich tapestry of aspects and KPIs that these dashboards encompass:
The Pulse of Performance
Imagine having a window into the superhuman world of physicians. It doesn’t just show how many patients a doctor sees; it’s an orchestra of data that conducts an entire symphony of insights:
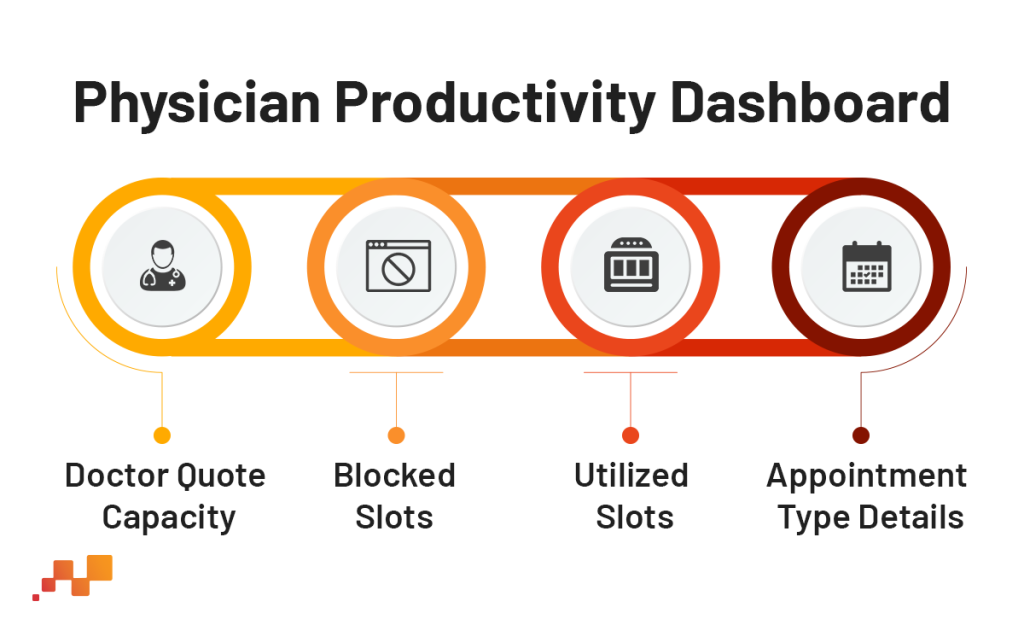
- Doctor Quote Capacity: A barometer of a physician’s workload capacity
- Blocked Slots: A compass pointing to scheduling inefficiency
- Utilized Slots: A scoreboard for successfully scheduled appointments
- Appointment Type Details: A catalog of appointment diversity
The Benefits:
- A holistic view of a physician’s productivity
- Spotlight on scheduling bottlenecks for immediate resolution
- Data-driven scheduling and capacity management
Where Patients Meet Care Excellence
This dashboard opens the doors to elevated patient experience, empowering executives to shape it like skilled artisans.
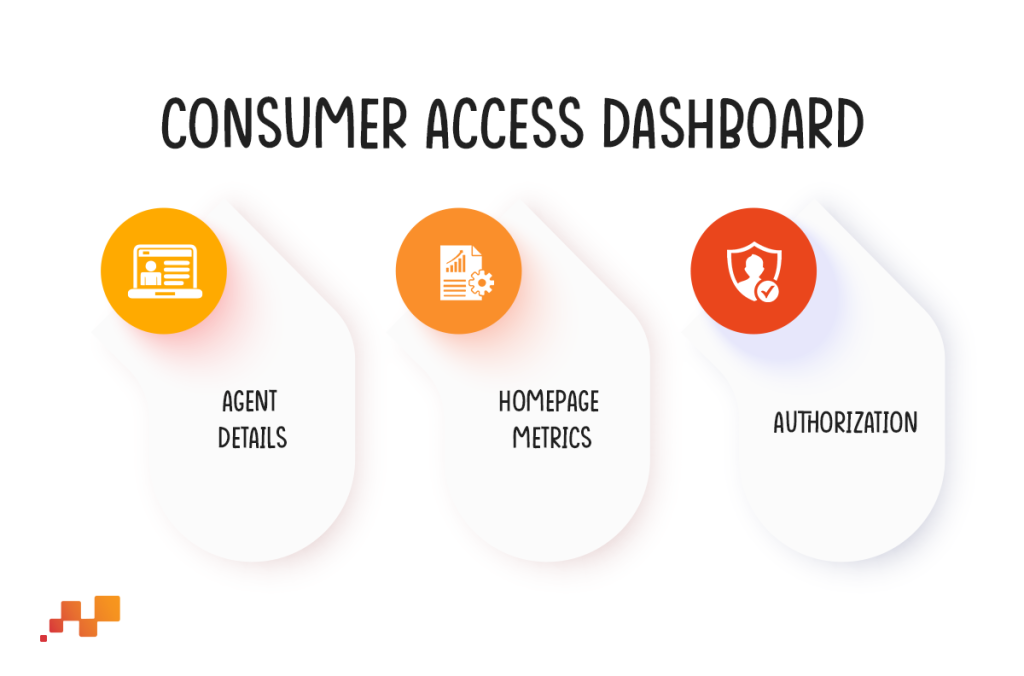
It has three captivating realms:
Agent Details: The Agent Details Dashboard furnishes vital insights into Agent Performance Metrics, encompassing key indicators such as total calls handled, average handle time (ensuring issue resolution within target timeframes), abandoned calls (minimizing call abandonment rates), outbound calls, and survey feedback (assessing patient satisfaction and agent helpfulness). These metrics can be accessed at both a high-level service line and team view, catering to executive-level audiences, as well as at the Agent Level for team managers. This comprehensive view aids in identifying underperforming teams and agents, pinpointing specific metrics where assistance is needed, and facilitating targeted support interventions.
Homepage Metrics: The CA-Homepage offers a high-level overview of service line performance, tailored for an executive-level audience. It presents essential Agent and Team metrics, such as average handle time, agent inbound/outbound calls, and survey responses. Additionally, it provides insights into Queue Metrics, including maximum queue, average queue time, and average speed of answer, alongside appointment-related statistics like scheduled, rescheduled, canceled, and no-show appointments.
The introduction of CA_Call Volumes, a feature designed to deliver queue-specific data, allows us to focus on the aforementioned Queue-level metrics. This functionality serves to illuminate the traffic patterns within each queue across various service lines, enabling the identification of underperforming or overburdened queues. This insight empowers stakeholders to offer targeted assistance where needed.
Utilizing Power of AI to Improve Patient Flow in Hospitals

Authorization: A compass for navigating the patient authorization process, tracking time-to-authorization and more.
The Benefits:
- Provides insights into patient interaction and access
- This roadmap is aimed at streamlining and enhancing call center processes
The dashboards do not directly identify authorization bottlenecks; instead, they seek to infer patterns within approved, pending, and denied appointments. They help identify which facilities experience higher numbers of approved or pending cases and track any seasonal fluctuations in these cases.
Maximizing the OR Efficiency
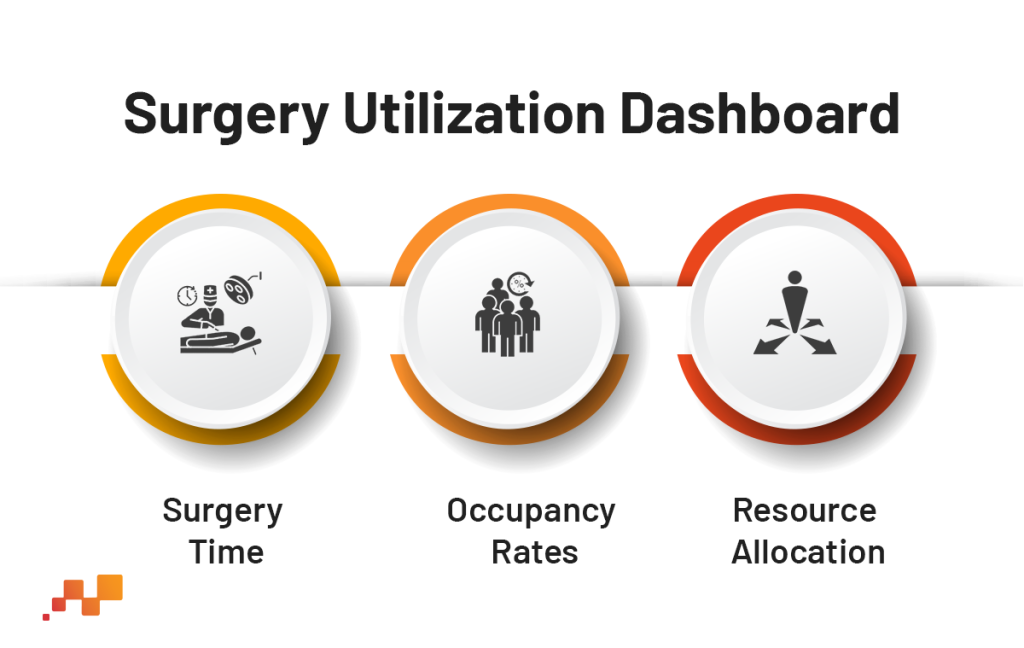
The dashboard identifies rooms that are either overburdened or underutilized, offering valuable insights for efficient surgery management and scheduling, ultimately optimizing the utilization of each operating room for enhanced effectiveness.
Surgery Time: A stopwatch for surgery duration, aiding in scheduling and resource allocation.
Occupancy Rates: A meter that gauges the efficiency of operating room usage.
Resource Allocation: A blueprint for staffing and equipment needs.
The Benefits:
- Increased efficiency in surgical services
- Reduced downtime in operating rooms
It primarily focuses on efficiently scheduling surgeries within each room, optimizing room utilization, and minimizing both equipment breakdowns and the occurrence of underutilized rooms.
Healing with Algorithms: AI’s Role in Healthcare
Data-Driven Leadership at its Finest
These executive dashboards not only offer real-time visibility into healthcare operations but also serve as the cornerstone of data-driven decision-making.
Here’s how they’re transforming the healthcare industry:
- Turbocharged Productivity: The Physician Productivity dashboard optimizes schedules, minimizes under booking, and prevents overbooking, all the while enhancing patient care.
- Elevated Patient Experience: The Consumer Access dashboard offers an eagle-eye view of customer service performance, paving the way for unforgettable patient experiences.
- Resource Allocation: The Surgery Utilization insights empower the leadership to allocate resources efficiently, driving down costs while elevating patient care standards.
- Swift Authorization: Authorization analytics reveal bottlenecks and inefficiencies, leading to speedier patient treatment.

Pioneering Healthcare Transformation with Predictive ML models
The executive dashboards are not just tools for decision-makers; they are treasure troves of data for ML teams. High-quality, real-time data is the lifeblood of predictive models that promise to revolutionize patient care, optimize resource allocation, and improve healthcare outcomes for good. Our healthcare analytics services can help organizations design effective BI dashboards that leverage real-time data. By embracing machine learning initiatives and co-creating executive dashboards that unlock transformative insights across various aspects and KPIs, we are not just leading the way; we are paving the path for others to follow—a path illuminated by data, innovation, and, above all, superior patient care.

The Future of Data Pipelines for Modern Enterprise...

Driving Value Outcomes in Orphan Drug Markets...

Smarter Healthcare Analytics with Snowflake and Ic...

Maximizing Sales ROI with Agentic AI...

Automating Patient Note Summarization Using Gen AI...


Enhancing CX and Reducing OpEx for Trucking Logist...


Personalizing Patient Care Through Data and AI...