In every business, it is very important to know whether your users or customers are liking your services and products. The customer Lifetime Value model helps businesses to track down how good they are resonating with their consumers. Although, calculating Customer Lifetime Value doesn’t need high-level arithmetic knowledge it needs a sharp calculation of any customer’s valuable data. Increasing customers value data is a good sign for any organization. Before jumping directly to the details, let’s know what Customer Lifetime Value is.
Introduction
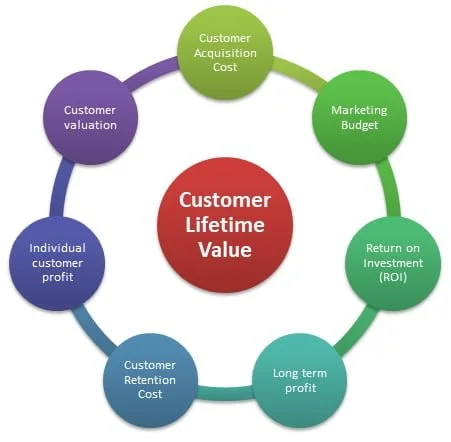
CLV stands for Customer Lifetime Value Model which includes ‘Easy to Interpret’ and ’Machine Learning Models’ at the customer level. Customer Lifetime Value or Lifetime Value (LTV) is the average amount of money a customer is spending on your business over the entire life. Customer\’s valuable data can help for any economic decision-making in a company which includes marketing budgets, resources, profitability, and forecasting. CLV act as a key metric in a subscription-based business model with Monthly Recurring Revenue
Objective
It has a robust and scalable process that adapts to change business and strategic needs such as spending changes, discounts, offers, etc. Its perpetual forecasting is without 6 years cap. Below, Tushar created the Scope and Model of CLV for NS and ITPS,
NOTE: In the given example, NS and ITPS are only for use case purposes.
SCOPE
-Machine Learning Model for ITPS, NS.
-Perpetual lifetime forecast without the 6-year cap.
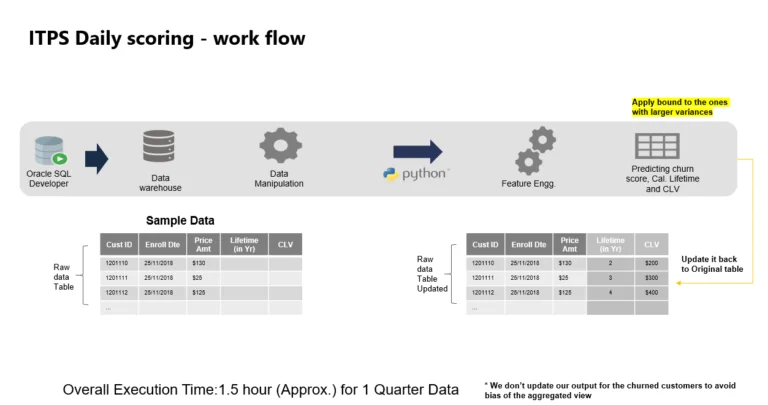
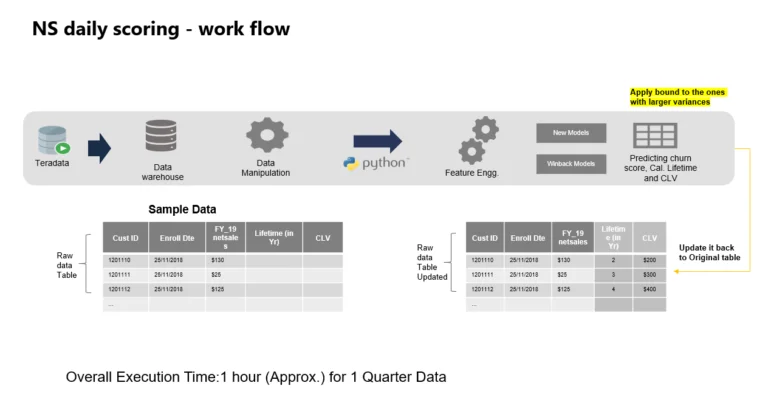
-Automated Daily score new enrolments for new & win back customers for lifetime and CLV.
-For NS, append reacquisition lifetime to the lifetime of new & win-back customers, and subtract the inactive gap.
-For NS, apply different retention ASP for various entitlement periods.
-Now, for ITPS, retention ASP is assumed the same as acquisition ASP, as there is no clear pattern of cross-selling or higher price for the discounted acquisition.
MODEL
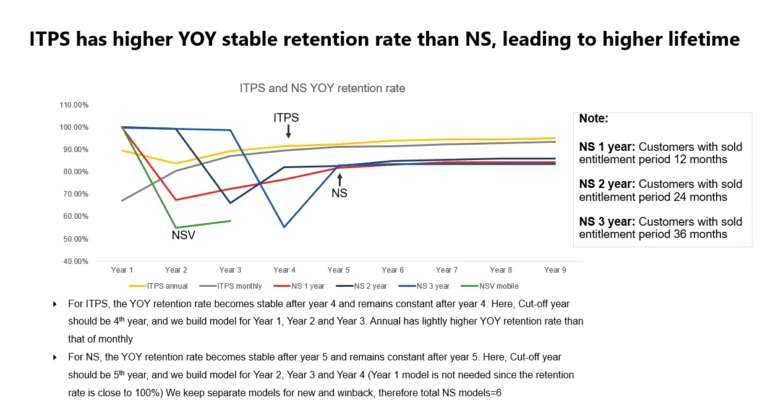
-Find a cut-off year from which the YoY retention will be stable.
-Build N models with year 1, year 2 …till year N (cut-off year)
-Target variable-churn rate
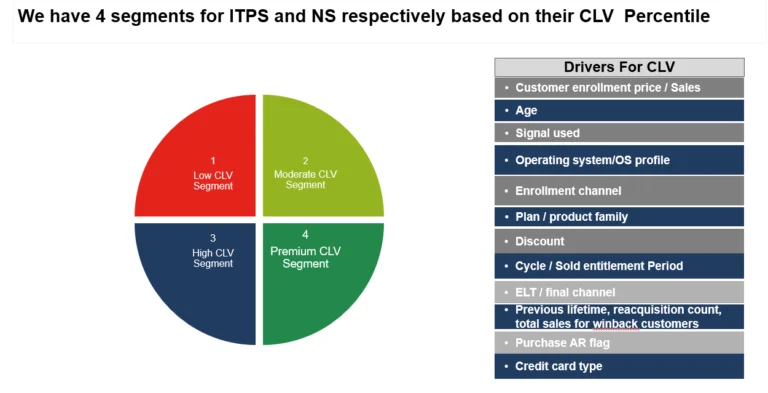
-For ITPS, use features including marketing channel, enrolment channel, primary flag, a signal used, operating system, plan, age, payment status, payment type, discount, cycle, promo channel, and breach flag.
-For NS, use features including bookings, discount, customer-ID type, enrolment AR flag, platform, payment type, OS profile, sold entitlement period, territory, product, subchannel, web channel, publisher, credit card type, win back-gap, previous lifetime, previous reacquisition count, previous enrolment sales, previous total sales, previous direct/indirect flag.
Approach
CLV uses a high volume of data for model stability, a tradeoff between data volume and data relevance. Performed EDA, feature engineering, tested bias, overfit, and imbalance data, and added domain knowledge to model learning. It has various modeling iterations with different combinations to select the best fit. Reacquisition and retention Application Service Provider adjustment is incorporated into the model. It automates the daily scoring of Customers. Below, given the Lifetime and CLV calculation of stable decay after Year N in NS and ITPS companies.
Lifetime and CLV calculation-stable decay after Year N
ITPS:
Lifetime = Yr1 retention rate+ Yr2 retention rate+ Yr3 retention rate + Yr3 retention rate /(1-YOY stable retention rate)
CLV = Lifetime* ARPU * yearly compounding discount factor
The analysis shows that retention ARPU is similar to acquisition ARPU without a clear pattern –using the Original customer price amount)
NS:
Lifetime = entitlement period +retention lifetime
CLV = acquisition bookings+ retention lifetime * retention ASP * yearly compounding discount factor
For different entitlement period: retention lifetime formula & retention ASP also varies
For ~1 year SKU: retention lifetime = Yr2 retention rate+ Yr3 retention rate + Yr4 retention rate + Yr4 retention rate /(1-YOY stable retention rate);
1 year SKU: retention ASP= 2 * acquisition ASP; 1 month SKU: retention ASP= 9 * acquisition ASP etc.
For 2 year SKU: retention lifetime = Yr3 retention rate + Yr4 retention rate + Yr4 retention rate /(1-YOY stable retention rate);
retention ASP= acquisition ASP
For 3 year SKU: retention lifetime = Yr4 retention rate + Yr4 retention rate /(1-YOY stable retention rate);
retention ASP=0.83 * Acquisition ASP
Change retention ASP to acquisition ASP if retention ASP >=200
Retention rate=1-Churn rate Yr4 retention rate=Yr1 retention rate* Yr2 YOY retention rate * Yr3 YOY retention rate * Yr4 YOY retention rate
The Model’s Key Insights
-The significant factors identified by the model follow general intuitions.
-Average customer lifetime for ITPS is 8 vs 5 for Norton.
-New customers have slightly higher CLV than win-back customers. Win back customers CLV decreases with the number of win back times.
-ITPS ROI is averaged across all channels at around 2.6, with Leads with the highest ROI and the lowest being NB SEM.
-NS ROI across regions is 2.54, Branded SEM has the highest ROI and NB SEM has a lower ROI.
So, this is all summed up with a brief knowledge of Customer Lifetime Value for subscription-based businesses. If summarizing the whole detail in one sentence, then yes, every business needs to grow with their customer’s valuable choice and CLV provides all those values in one plate which makes any business easy to serve.
About the Author
Tushar V. Kotangale is an Assistant Manager at Factspan and a very enthusiastic employee. Being a graduate of IIT Kanpur, Tushar has a wide array of experience in Analytics across multiple domains. Also, he loves the leading bunch of young talented, enthusiastic, and passionate people. Besides professional work, Tushar is very passionate about traveling and loves discovering new things and places.
